
Article | 12 minutes read

How much does a player deposit, lose and bet at an online casino in a typical month? According to a new study, the answer varies depending on the country where they play.
A new large-scale player-tracking study of 926,086 real-world online gamblers across six countries has put hard numbers on a long-running debate. Stricter regulation is linked to lower gambling spend, while looser rules are linked to higher expenditure.
Researchers Michael Auer and Mark D. Griffiths published their findings in Acta Psychologica in April 2026: Differences in online gambling expenditure between players from Germany, Spain, Netherlands, Great Britain, US and Canada: A large-scale online player tracking study.
They analyzed data on the total amounts of money bet, lost, and deposited by players across six countries with varying levels of regulatory restrictions. Their research also assessed average bet per game, session length, and deposit behavior.
The dataset covered all players who gambled on licensed sites in Great Britain, the Netherlands, Germany, Spain, Canada (Ontario), and the United States, throughout October 2025.
Headline numbers reveal striking differences across the six markets. The median total amount of money bet per player in October 2025 ranged from €74 in Germany, the most heavily regulated market, to €395 in the US, the least restricted market.
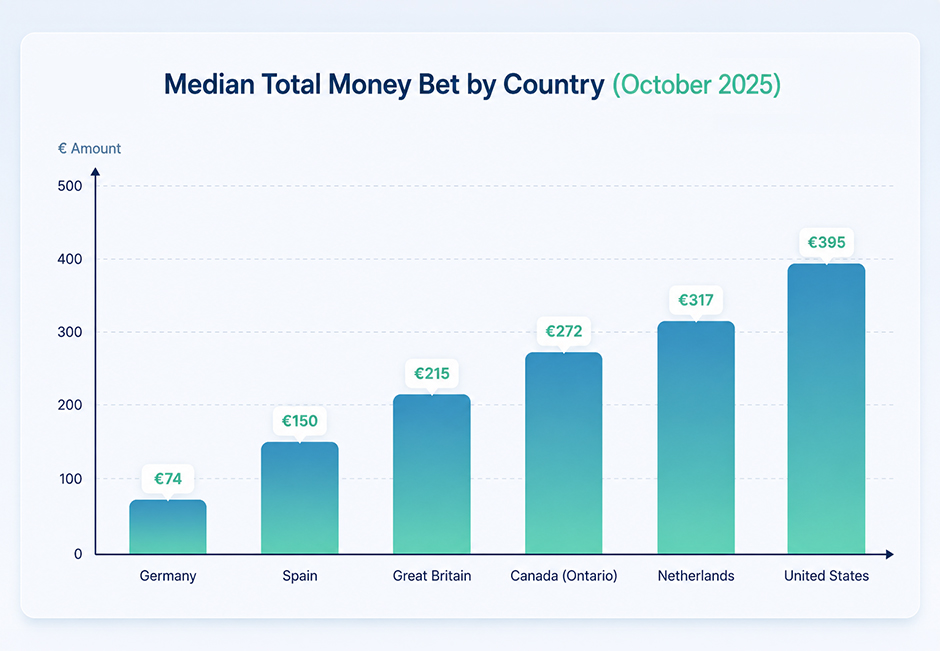
Mean values, which are inflated by heavy bettors, diverge even more sharply. The average US player bet €11,165 in October 2025, while the average Canadian player bet €6,434. By contrast, Germany’s mean was €638, and the Netherlands’ was €1,327.
| Country | Total Money Bet (€) – Mean | Total Money Bet (€) – Median | Average Bet Per Game (€) – Mean | Average Bet Per Game (€) – Median |
|---|---|---|---|---|
| Germany | 638 | 74 | 0.27 | 0.17 |
| Spain | 2,868 | 150 | 3.18 | 0.30 |
| Netherlands | 1,327 | 317 | 5.31 | 0.76 |
| Great Britain | 2,123 | 215 | 2.45 | 0.43 |
| Canada (Ontario) | 6,434 | 272 | 4.70 | 0.50 |
| United States | 11,165 | 395 | 9.10 | 0.85 |
Germany sits at the bottom of nearly every spend metric in the study, and its restrictive regulations explain the pattern. The country’s Interstate Gambling Treaty caps stakes at €1 per slot spin, sets a 5-second minimum game duration, bans autoplay, and limits licensed online casinos to slots only.
Most importantly, Germany operates the only true single customer view in the dataset. It has a centralized government database that enforces a €1,000 monthly deposit limit across all licensed operators simultaneously.
That last point matters. Elsewhere in the dataset, deposit and loss limits apply per operator. That means a determined player can open multiple accounts at different licensed sites to sidestep them, as highlighted in a recent report of the Dutch online gambling market. In Germany, the deposit limit follows the player, not the brand.
The Netherlands also has a strict framework. It imposes a €700 monthly deposit limit (€300 for 18–24-year-olds), real-time behavioral monitoring, and mandatory operator intervention within one hour of detecting risky play.
The effects of both countries’ rules are clearly evident in the data. Dutch and German players deposit less on average and show more even spending distributions than players elsewhere.
Across all six markets, the study confirmed a familiar pattern. A small share of players generates most of the revenue. But how concentrated that revenue is varies sharply by country.
In the US, the top 20% of players accounted for 95% of total bets. In Canada, it was 94%. The Netherlands sat at the other end of the scale, with the top 20% generating 79%, the most equal distribution among the six.
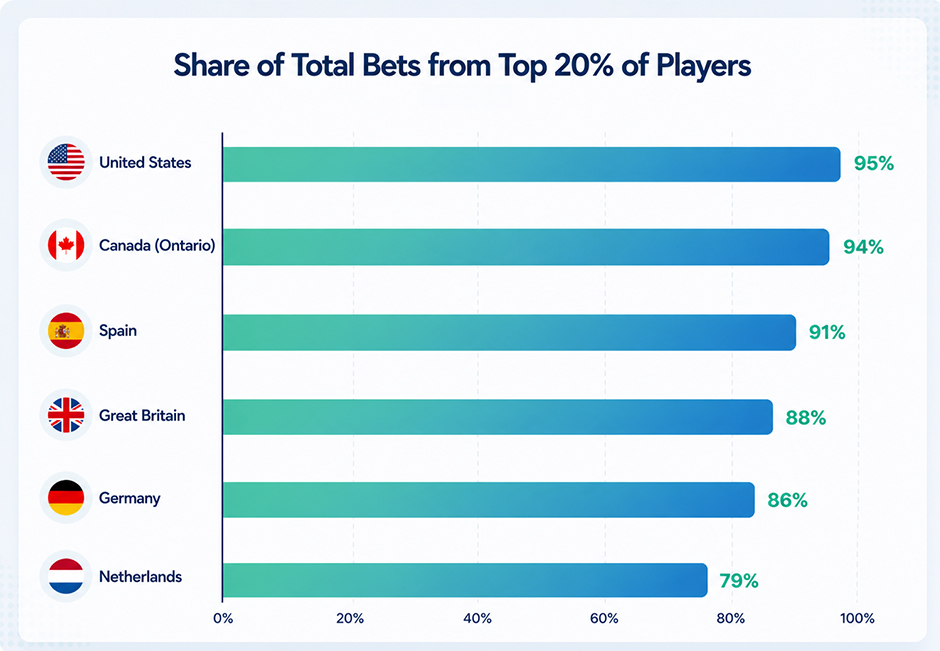
The Gini coefficient, a standard measure of inequality, backs up the visual story. Markets where players face fewer restrictions show more skewed distributions, with operator revenue more dependent on a small group of intense players. Tighter rules push spending closer to the middle of the curve.
Looking at losses rather than bets, the picture shifts in two ways. First, among the European markets, German players still lost the least per month with a median loss of €15, followed by Spain with €18. Dutch, British, and Canadian medians fell in a similar range.
| Country | Total Amount of Money Lost (€) – Median |
|---|---|
| Germany | 15 |
| Spain | 18 |
| Netherlands | 30 |
| Great Britain | 28 |
| Canada (Ontario) | 30 |
| United States | 12.73 |
Second, the US figures look unusual at first glance, with a median monthly loss of just €12.73 despite a mean total amount bet of €11,165. The authors explain why. The US sample included a handful of players who won very large sums, with the top 10 wins ranging from €630,000 to €11.14 million.
No other country saw wins anywhere near that scale, and those outliers distorted the loss figures. Adjusting for a typical 4–11% house edge, the authors estimate that the US true mean loss was between €447 and €1,117 per month. That is by far the highest in the sample.
Pulling the various results together, the study’s authors describe an inverse correlation between regulatory strictness and gambling intensity:
That finding points to a difficult situation for European policymakers. Stricter rules can reduce harm, but they can also push some players toward unlicensed operators, where there are no protections. It’s a delicate balance, which one of the study’s authors, Mark D. Griffiths, previously discussed in a podcast episode with iGaming.com’s CEO, Prof. Dr. Andreas Ditsche.
Reflecting that notion, the Netherlands’ revenue-based channelization has dropped to 53%. Meanwhile, Germany’s strict framework has coexisted with a sizable black market, and to date, no fines yet being issued to licensed operators there.
With seven states already permitting online casino gaming and 32 offering online sports betting, US gambling intensity already eclipses every European market in the study. Whether that intensity reflects engaged consumers or under-protected ones depends largely on how operators monitor risky play patterns.
The study’s deeper finding is structural. In every country, online gambling revenue depends heavily on a small minority of high-stakes customers. That is a pattern that the UK Gambling Commission has been publicly trying to change.
Recent UKGC monitoring data shows the share of revenue from “high-spending customers” at one large operator dropped from 19% to 5% over three years. The regulator attributed an overall 16% decline in gross gambling yield to operators “withdrawing from what they regard as higher-risk staking and losses.” The sharp decline in the number of VIP customers also reflects that shift.
For regulators, the trade-off is clear. Rules that flatten the distribution reduce dependence on a small high-risk group but also shrink overall revenue. For operators, the message from this study is that markets adapt to rules, and the players who push limits hardest are the ones limits affect the most.