Alberta Online Gambling Market · July 2026
Albertans already gamble more than any other Canadians. Most of it is offshore. On July 13, Alberta brings it home.
A ten-year forecast of Canada’s newest regulated online gambling market: about $1.5 billion a year by 2036, built almost entirely on play that already exists.
-
$335
gambling profit per adult to Alberta public funds in 2024, the highest of any province and nearly double Ontario. Includes all forms of gambling.
Statistics Canada
-
70%
of Alberta’s online gambling ran through unregulated sites going into launch, by the province’s own estimate.
Government of Alberta
-
$1.5B
a year in regulated revenue by 2036, from about $0.37 billion in year one.
iGaming.com forecast
At a glance
Introduction
Albertans put more money into gambling than any other Canadians: $335 in gambling profit per adult reached public funds in 2024, nearly double Ontario, and that counts only the regulated share. About 70% of the province’s online play runs through sites Alberta cannot regulate, tax or make safe. On July 13 that changes. The iGaming Alberta Act opens a fully competitive market with about 46 operators registered for day one, more than triple the number Ontario launched with.
iGaming.com’s forecast has the regulated market growing from about $0.37 billion in its first year to about $1.5 billion by 2036, with roughly $300 million a year flowing to the province at maturity. Almost all of it is existing play moving onshore, not new gambling. The open question is pace, and Ontario’s record suggests the official numbers are underestimating it.
Five numbers that matter
-
Albertans already gamble more per adult than any other Canadians: $335 to public funds in 2024, nearly double Ontario.
-
About 70% of Alberta’s online gambling was unregulated going into launch, so July 13 recaptures an existing market more than it creates one.
-
The regulated market is forecast to reach about $1.5 billion a year by 2036, inside a range of $0.9 billion to $2.3 billion.
-
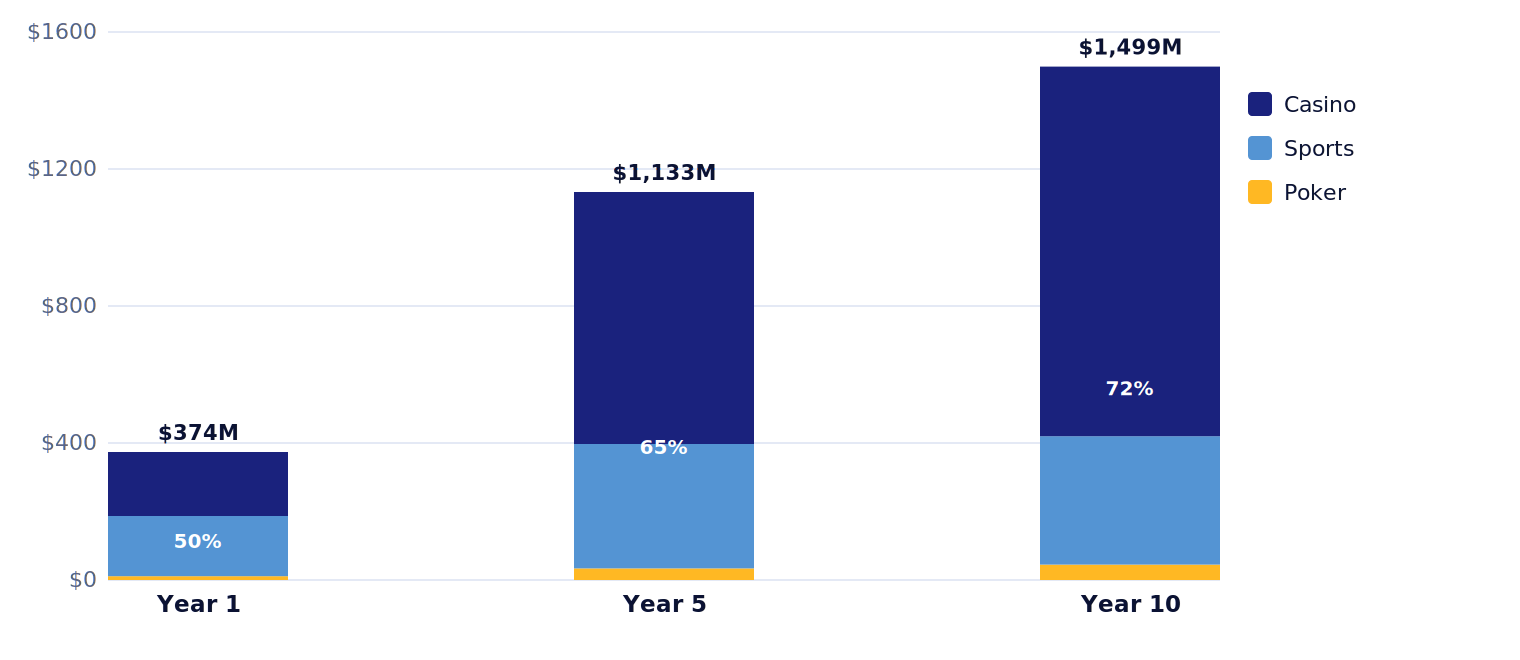
Casino, not sports betting, carries the long-term value: the mix rotates to about 72% casino by maturity.
-
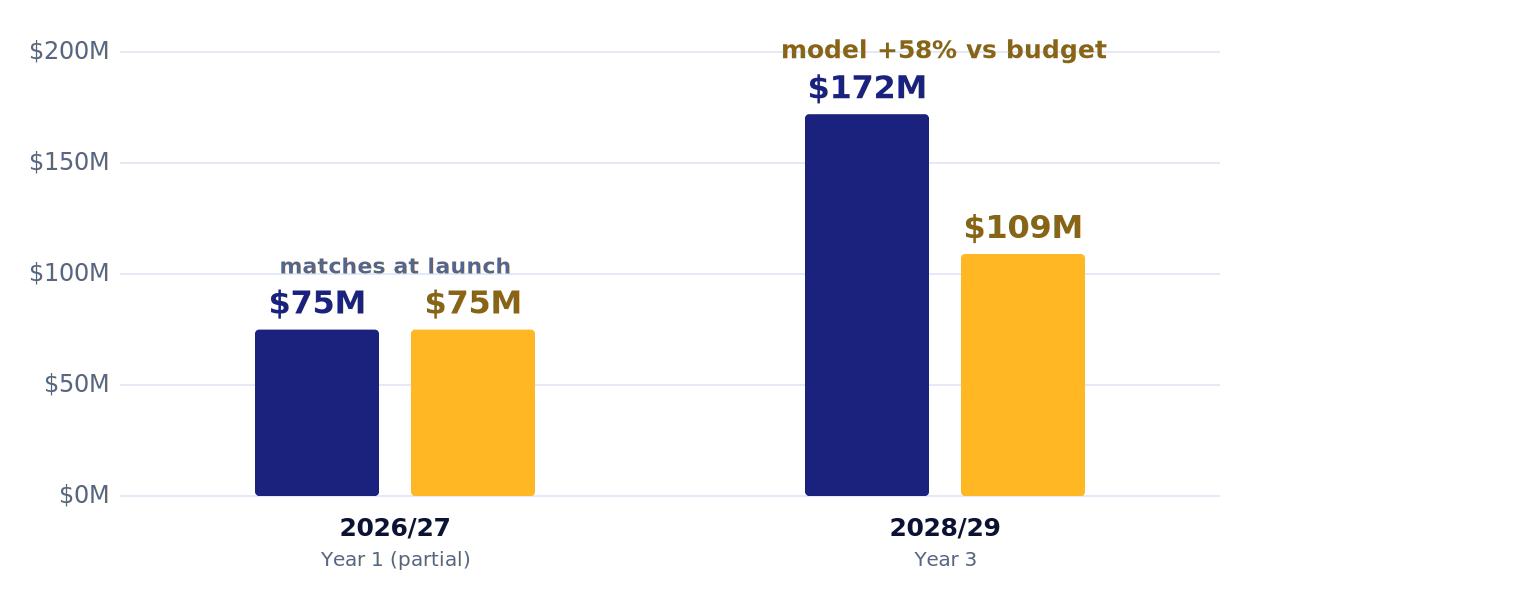
Alberta’s own budget may be underestimating the revenue: $109 million projected by 2028/29, against $130 million to $190 million implied by the model.
The road to July 13
-
2022
Ontario opens Canada’s first competitive online market
-
2025
The iGaming Alberta Act passes
-
13 July 2026
Alberta’s market opens
-
Late 2026 into 2027
First official market data expected
-
Then
This forecast is rerun against the actuals
01
The market that already exists
Alberta is not about to start gambling online. It already does, more heavily than anywhere else in Canada, and mostly out of sight.
Statistics Canada counted $335 of gambling profit per adult flowing into Alberta’s public funds in 2024, the highest of any province, and gambling’s 1.52% share of provincial revenue is the highest in the country too. Those figures cover all gambling, so they measure appetite rather than the online market itself. The part the province cannot see is bigger: by its own estimate, about 70% of Alberta’s online play happens on unregulated sites. The lone legal option, AGLC’s PlayAlberta, took in about $270 million online last fiscal year. That is the floor of the new market, not its size.
Alberta already has one of Canada’s biggest gambling markets. It just cannot see most of it.
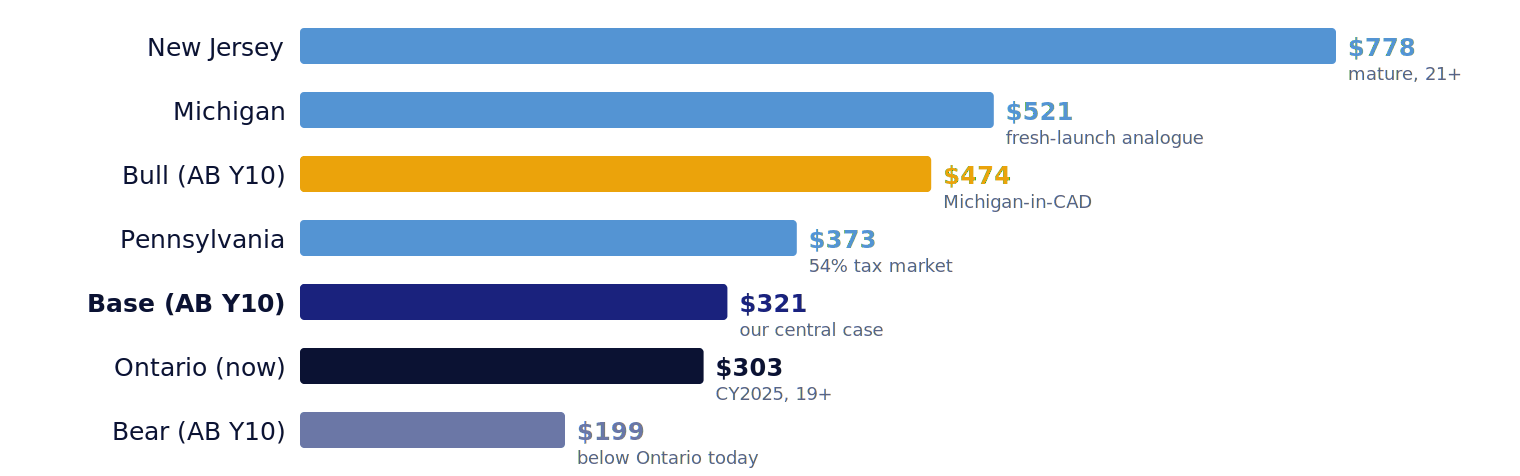
Revenue per adult: where Alberta’s forecast sits
Combined online revenue per adult, CAD
02
What changes on July 13
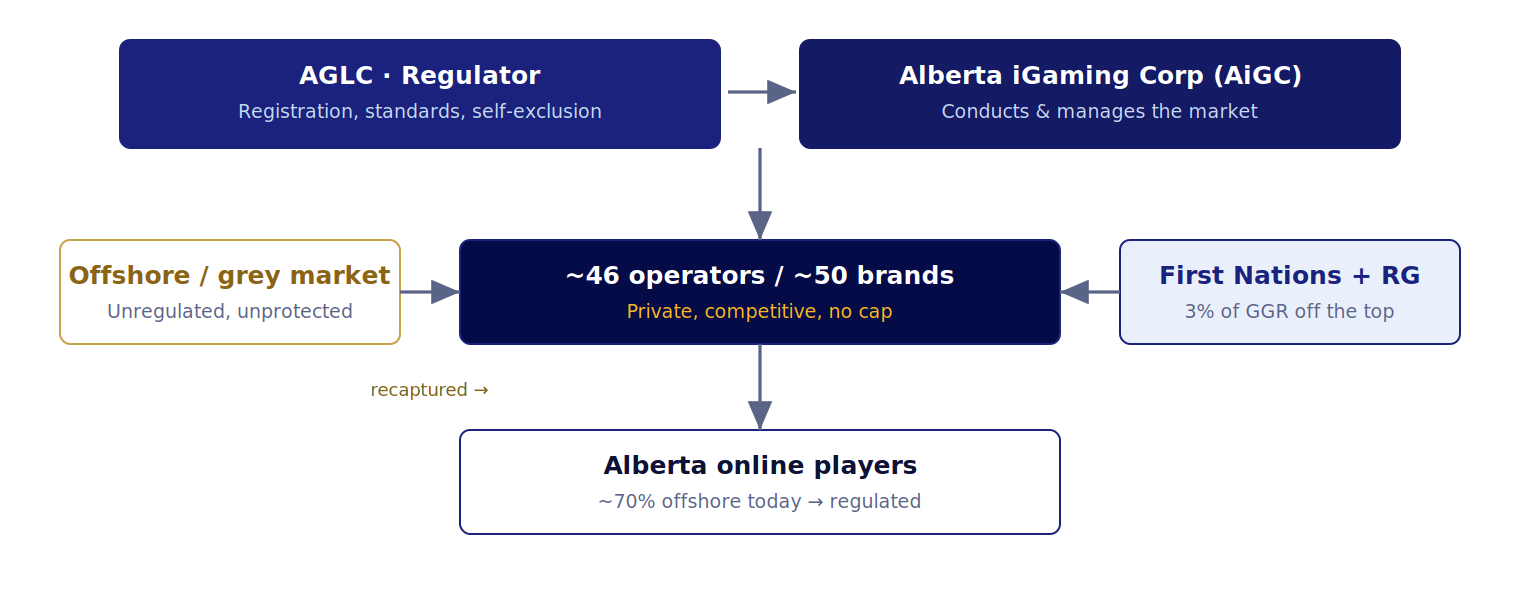
The iGaming Alberta Act copies Ontario’s model almost exactly: AGLC regulates, a new Crown agency, the Alberta iGaming Corporation, runs the commercial market, no cap on operators, legal age 18. Two design choices set it apart.
-
The take: about 20% of gaming revenue
Three percent off the top for First Nations and responsible gambling, then an 80/20 operator split. Among the lowest rates in North America; Pennsylvania taxes online slots at 54%.
-
The cutoff
Unregulated sites must stop serving Alberta at launch, an enforcement lever Ontario never had. It is the forecast’s main argument for a fast ramp.
The Alberta market ecosystem
Who conducts the market, who competes, and where the money flows
03
A launch field triple Ontario’s
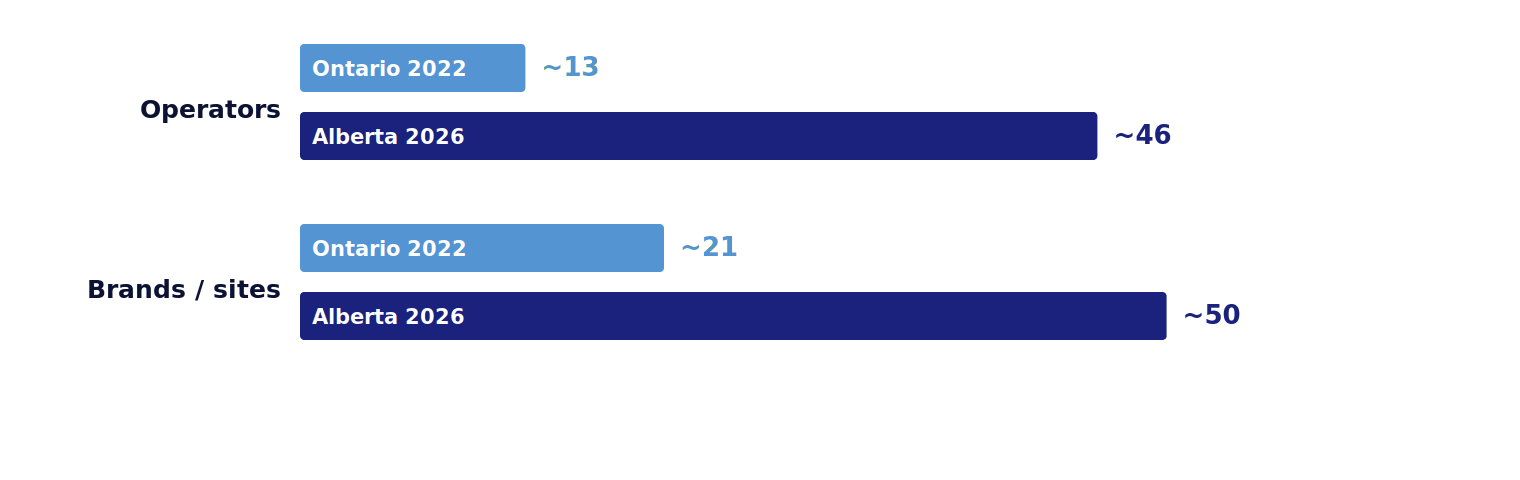
About 46 operators and 50 brands registered for launch; Ontario opened with roughly 13 and 21. The names are the ones Ontarians already know: FanDuel, registered in Calgary, plus DraftKings, BetMGM, bet365, Entain, BetRivers, theScore, PointsBet, Bally’s and Betano, arriving with Canadian operations already built. First Nations operators are in the field too, including Enoch Cree Nation’s River Cree and Indigenous Gaming Partners’ Pure Casino. A mature field on day one means heavy marketing, fast acquisition, and a steeper ramp than a standing start.
A materially larger launch field than Ontario
Registered operators and brands/sites at market open
04
The forecast
| Regulated online GGR | Year 1 | Year 5 | Year 10 | 10-year cumulative |
|---|---|---|---|---|
| Bear | $0.26B | $0.71B | $0.87B | ~$6.7B |
| Base | $0.37B | $1.13B | $1.50B | ~$10.9B |
| Bull | $0.58B | $1.62B | $2.30B | ~$16.0B |
iGaming.com model; nominal CAD. GGR is gross gaming revenue: wagers minus winnings. Bear assumes weak enforcement and an oil downturn; bull, fast capture at Michigan-level spend per adult.
By year ten the base case reaches about $321 of regulated revenue per adult, ahead of Ontario’s roughly $303 in 2025, on higher incomes and the country’s strongest gambling appetite. Total wagers reach about $39 billion a year.
Working with the numbers?
Download the dataset: every driver and scenario, year by year, assumptions included
If you only read one chart
Regulated online GGR, three scenarios
Gross gaming revenue, $M, years 1 to 10
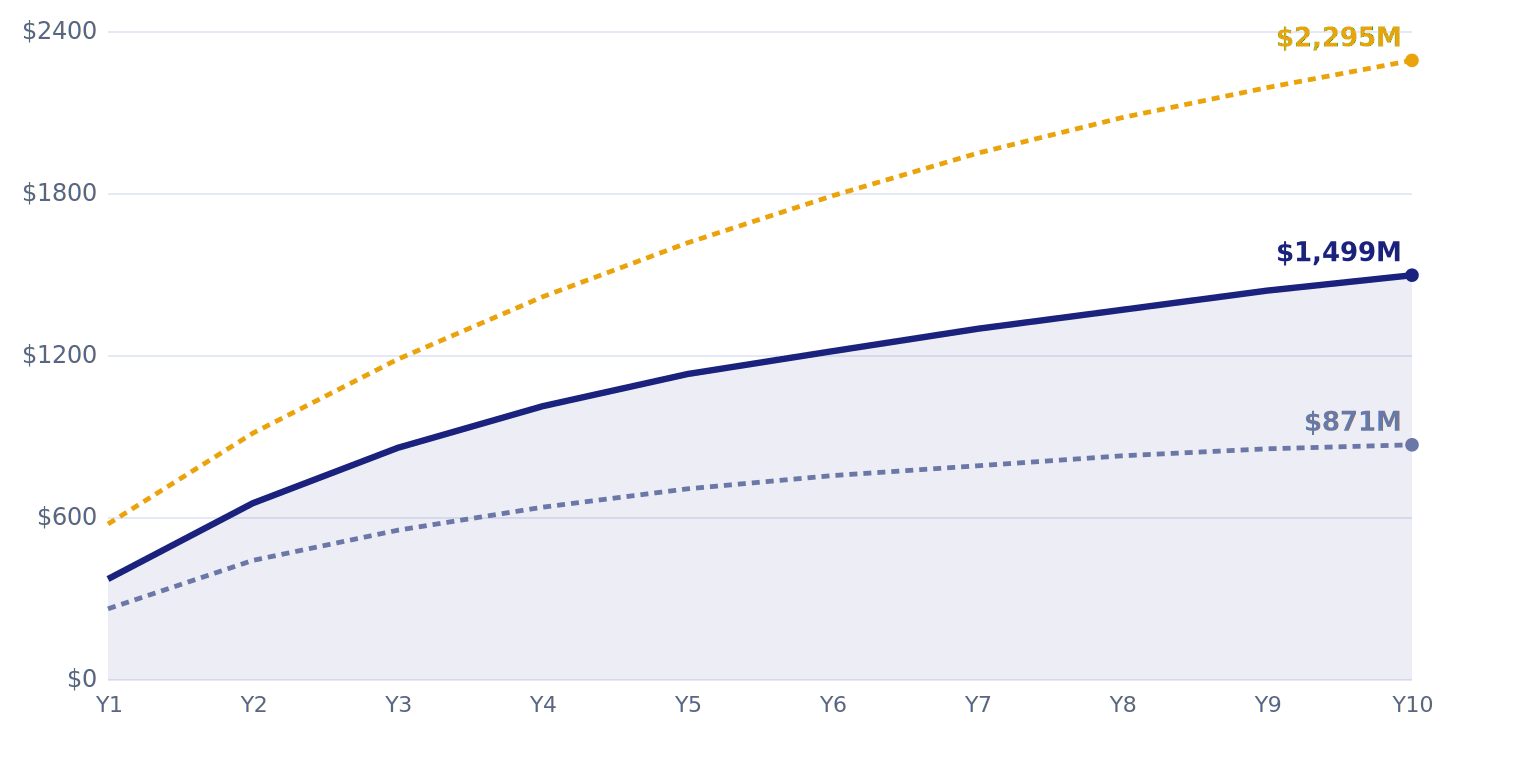
This is the forecast in one image: three paths from launch to 2036, ending at $0.9 billion, $1.5 billion and $2.3 billion a year. The spread is an honest statement of how much uncertainty a market carries before it opens.
Read the shape before the numbers. Every path climbs steeply, then bends flat: 75% growth in year two decaying toward 4% by year ten. That is the signature of a recapture market. Regulation does not build demand slowly; it converts existing offshore play quickly, then matures.
What separates the lines is mostly one variable: how much play moves onshore, and how fast. Strong enforcement pushes Alberta toward the top of the range; weak enforcement or an oil downturn drags it down. The first official data, expected late 2026 into 2027, will start telling us which line Alberta is on.
05
Why Ontario predicts the ramp
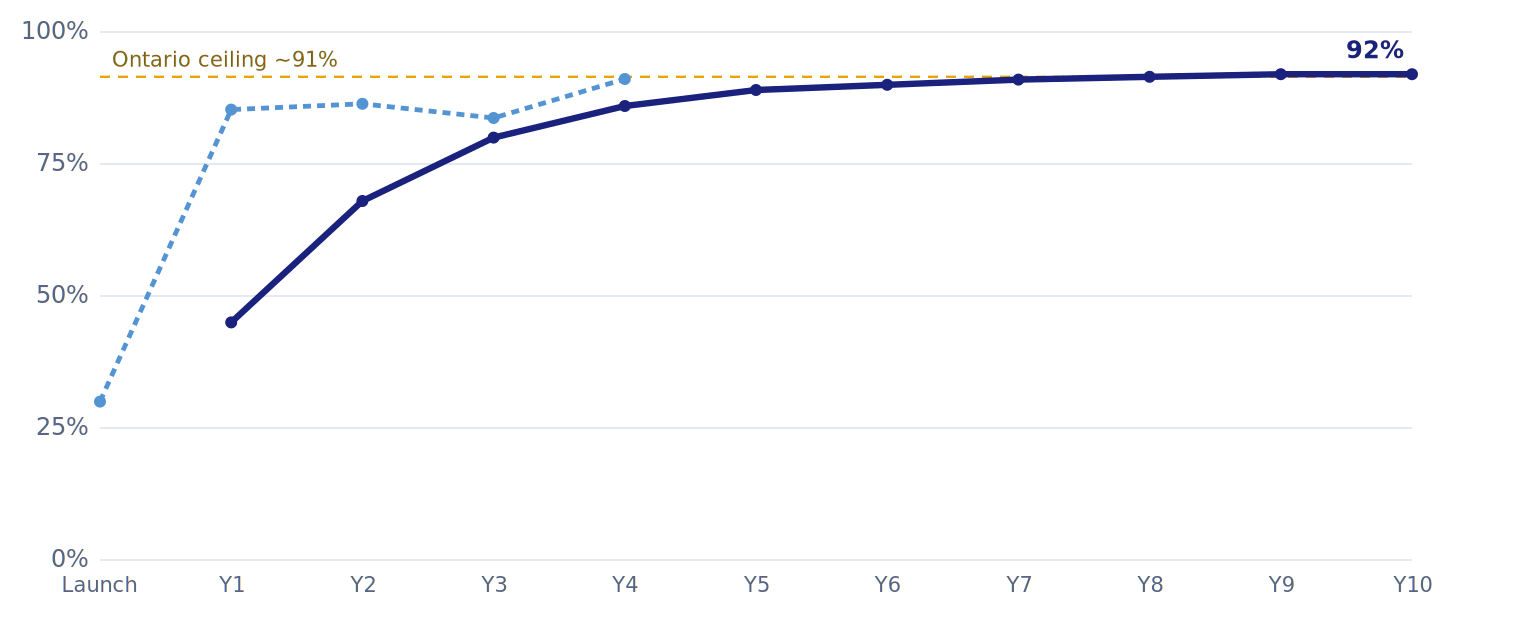
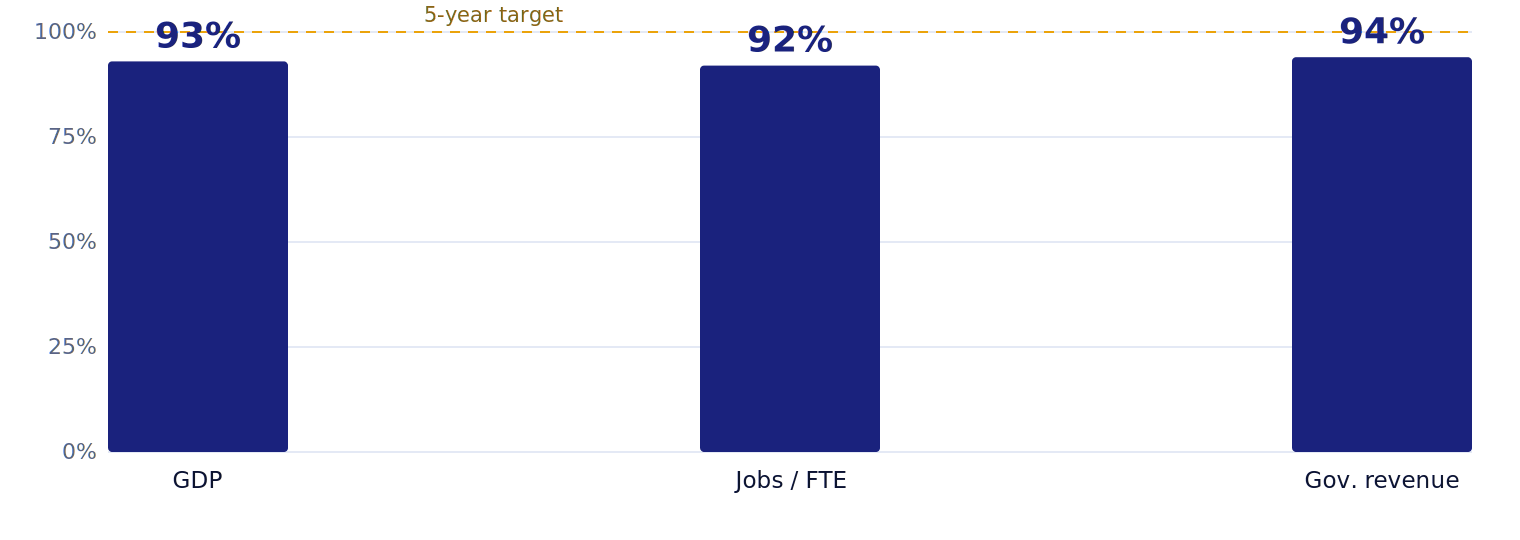
The share of play on regulated sites decides the first five years. The base case takes Alberta from 45% in year one to 92% by year ten, and that path is borrowed, not invented: Alberta copied Ontario’s legal model, shares its currency, banking and operators, and Ontario reached about 91% within four years of launch. Ontario also showed what official caution looks like, hitting 93% of a five-year economic forecast within two years. Alberta starts with two advantages Ontario lacked: the launch-day cutoff and a mature field.
Ontario reached 91% channelization in four years, and 93% of its five-year forecast in two.
Source: iGaming Ontario; Deloitte
The Ontario ramp the forecast transfers
Ontario beat its five-year forecast in two years
06
What the province earns
At about 20% of gaming revenue, the model puts government income near $75 million in year one, climbing to about $300 million a year by 2036. Beyond the treasury line, three percent of all revenue goes to First Nations and responsible gambling, a First Nations Development Fund rises from $12 million to $17 million, and offshore play comes under Alberta’s rules and self-exclusion system for the first time.
Then there is a gap that deserves careful attention.
Alberta Budget 2026
$75M in 2026/27, rising to $109M by 2028/29
This model
$130M to $190M by 2028/29
Why the gap? Budget caution, or a tax base of net revenue after promotional credits (a question the province has not clarified), or both. Ontario’s actuals beat its forecast.
The budget says $109 million. The model says $130 million to $190 million.
How conservative is the province’s own budget?
Government revenue, model versus the Alberta Budget line, $M
Comparing the model with the budget?
The government-revenue file has the model against the budget line, year by year
07
Casino takes the market
Launch week will look like a sports betting story: sportsbook brands lead the marketing and the early mix. The forecast says that is temporary. In every mature market examined, online casino runs two to five times sports revenue, and Alberta’s mix rotates to about 72% casino by maturity, the same turn Ontario and the US states took. The durable story is slots and table hold, not odds boards.
Casino, not sports betting, drives the market’s long-term value.
Product mix rotates to casino
GGR by product, $M, at years 1, 5 and 10
08
What could go wrong
A forecast that cannot fail is not a forecast. Four risks, in order of distinctiveness:
-
Oil
A downturn squeezes spending, participation and migration at once. The main force behind the bear case, and unique to Alberta.
-
Enforcement
If the offshore cutoff is weakly policed, capture stalls in the low 80s and the whole curve shifts down.
-
Advertising rules
Federal Bill S-269 or AGLC limits could slow the launch years.
-
The tax base
If the 20% applies to net rather than gross revenue, the government earns less. The market itself is unaffected.
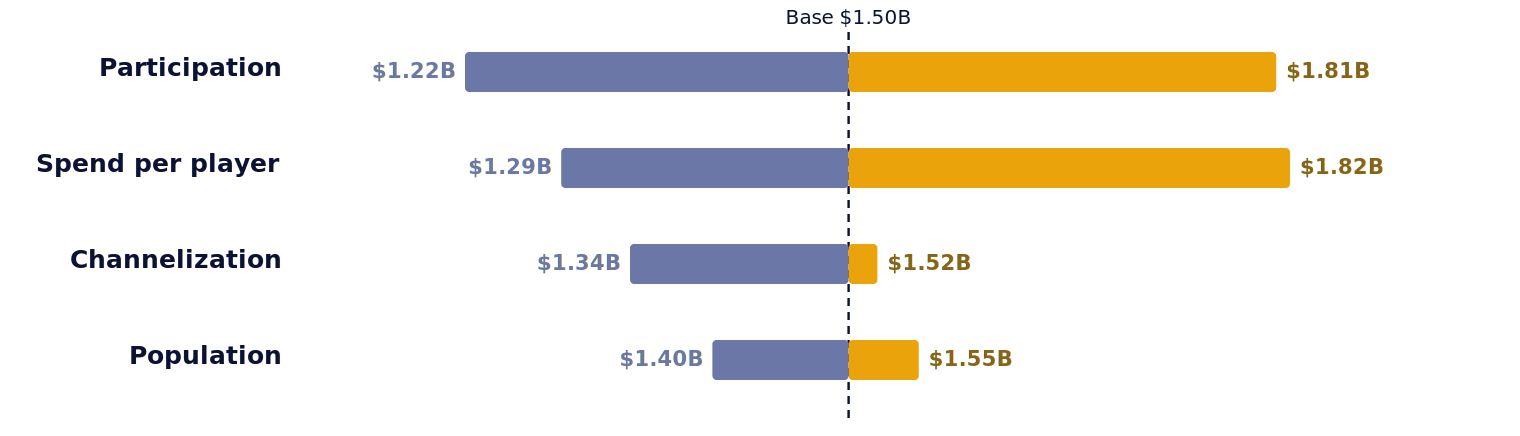
What moves year-10 GGR
Year-10 GGR when each driver is flexed across its full range
Facts vs myths
-
“Sports betting will drive Alberta’s market.”
Casino will, and quickly. Online casino runs two to five times sports revenue in every mature market examined; Alberta’s mix rotates to about 72% casino by maturity.
Report, Fig 7
-
“Most gambling will stay offshore anyway.”
Ontario moved roughly 91% of online play onto regulated sites within four years, without Alberta’s launch-day enforcement lever. The base case reaches 92%.
Report, Fig 5
-
“Ontario is too different to tell us anything about Alberta.”
Alberta copied Ontario’s legal model almost exactly and shares its currency, banking and operators; the model adjusts for what differs. There is no closer comparator.
Methodology
-
“The government’s own forecast is the ceiling.”
Official forecasts of new gambling markets have run low, not high. Ontario’s actuals hit 93% of a five-year forecast within two years; Alberta budgets $109 million by 2028/29 while the model implies $130 million to $190 million.
Report, Figs 9 and 12
-
“The market will mature overnight.”
The start is fast, the maturing is not: 75% growth in year two decays toward 4% by year ten, and the casino rotation takes the decade.
Report, Fig 1
-
“This creates a new gambling problem.”
The gambling largely exists already; what changes is oversight. About 70% of play was unregulated going into launch, beyond provincial rules, taxation and self-exclusion. The honest counterweight, stated in the report: high propensity raises exposure to harm, and Canadian problem-gambling data is dated.
Government of Alberta; report limitations
Every chart on this page, ready to publish.
Methodology
The forecast was produced by iGaming.com using a driver model of Alberta’s regulated online gambling market, projected over ten years from the market opening on 13 July 2026.
- The model. Adult population, the share of adults gambling online, the share of that play on regulated sites, and revenue per player. Revenue is split by product; handle, government revenue and per-capita metrics are derived from it.
- The anchor. Ontario, Canada’s only mature open online market, sets the base case. New Jersey, Michigan and Pennsylvania bound the scenarios.
- The sources. Government, regulator and statistical publications only.
- The labelling. Forecasts are presented as modelled estimates with a bear-to-bull range. The full methodology, assumptions and source list are in the report.
- The cross-check. After completion, the forecast was reconciled against H2 Gambling Capital’s independent Alberta outlook. The two models agree on the market’s structure and eventual scale; H2’s path is faster. H2’s figures were used as a comparison only, never as a model input; the full reconciliation is in the report appendix.
What this research cannot tell you
Year one is a true forecast, built before the market opened, until real data arrives. The 70% figure is the province’s own estimate. Most of these operators are licensed in other jurisdictions, from Gibraltar to the Mohawk Territory of Kahnawà:ke; none is regulated in Alberta, which is what matters for taxation, oversight and player protection. Whether the government’s 20% applies to gross or net revenue is unresolved, and moves the fiscal numbers. Problem-gambling data in Canada is dated, and Alberta’s oil dependence makes this range wider than a comparable forecast for any other province. The bear case is not decoration.
Take the research with you
Reusable with credit: “Alberta Online Gambling Market Forecast, iGaming.com”, linked to this page.
-
The complete report
The full analysis: market, launch, forecast, fiscal comparison, risks, methodology, sources, 12 charts.
-
Executive summary
The forecast on one sheet, ready to share.
-
The forecast dataset
Every driver, scenario and fiscal line, year by year, with the assumptions. Build your own charts; run your own checks.
Chart index
- 1. Regulated online GGR, three scenarios
- 2. The Alberta market ecosystem
- 3. A larger launch field than Ontario
- 4. Revenue per adult
- 5. The Ontario ramp
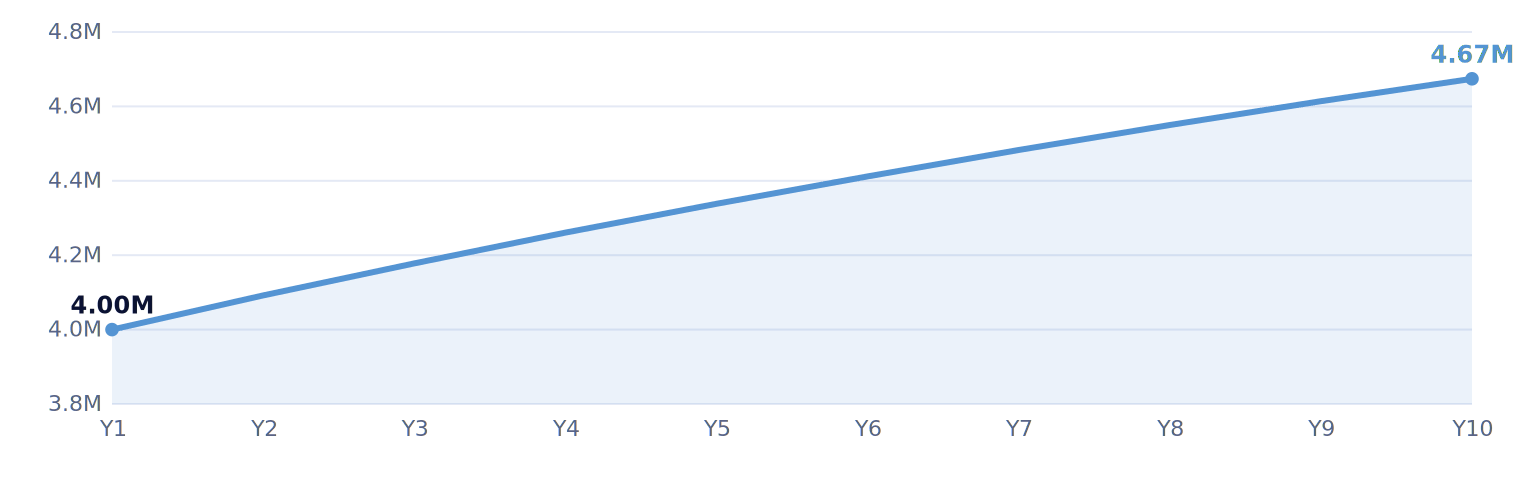 6. Adult population
- 7. Product mix rotates to casino
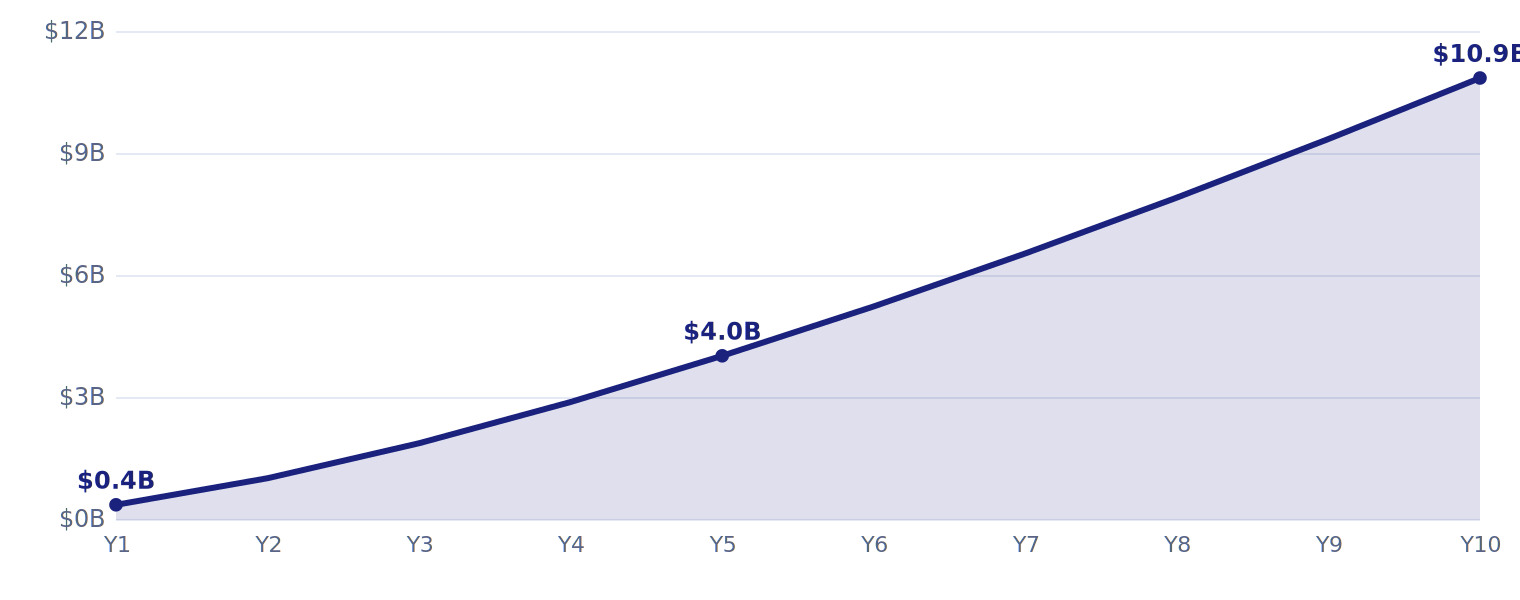 8. Cumulative ten-year GGR
- 9. How conservative is the budget?
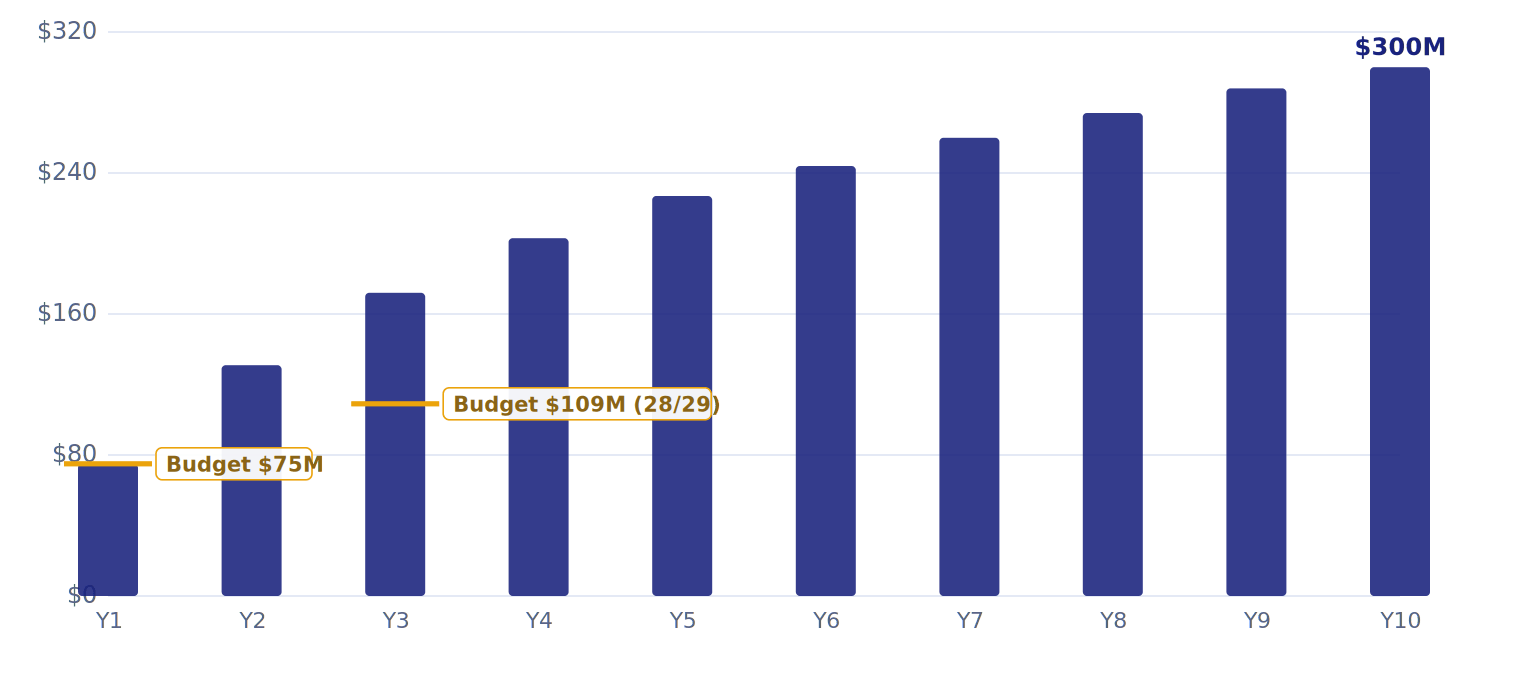 10. Government revenue to ~$300M
- 11. What moves year-10 GGR
- 12. Ontario beat its forecast
If you reference this research, please link to this page rather than the PDF, so your readers always reach the current version.
Media enquiries: press@igaming.comQuestions we expect
Straight answers to the questions we get asked most. If yours is missing, email us and we will answer it and add it here.
-
Is the $1.5 billion a fact or a forecast?
A forecast, labelled as one, with a published range of $0.9 billion to $2.3 billion. The lead findings are not forecasts: Albertans wager more per adult than any other Canadians ($335 across all gambling, Statistics Canada) and about 70% of the province’s online play is with unregulated operators (Government of Alberta). Strip the forecast out entirely and those facts still stand.
-
Why forecast ten years instead of five?
Because at year five a new online market is still climbing, and a five-year figure would understate its real size. Ontario’s regulated share of play was still rising in its fourth year, New Jersey was still growing twelve years after launch, and Michigan doubled between years one and four. Markets like this settle around years seven to ten. Stopping at year five would have reported a $1.13 billion market, about a quarter below the mature level. The price is wider uncertainty in the later years, which the bear-to-bull range is there to carry.
-
Why does Alberta’s own budget expect less than this model?
The two agree in year one, then diverge: the budget shows $109 million by 2028/29 against the model’s $130 million to $190 million. The likeliest explanations are deliberate caution on a brand-new revenue line, which is normal budgeting practice and exactly what Ontario did before its launch, and an unresolved technical question about whether the government’s 20% applies before or after promotional credits. The budget line lands close to our bear case, so one way to read it: the province has budgeted for our worst case, while our base case assumes Alberta repeats Ontario’s experience. The first year of actuals will settle it.
-
Why should Ontario predict anything about Alberta?
Alberta copied Ontario’s legal model almost exactly and shares the country, currency, banking system and the same major operators. It is the closest comparator that exists. The model adjusts for the differences: a smaller but higher-income, higher-gambling, oil-sensitive population, and a launch field of experienced operators from day one.
-
What is GGR, and is it operator profit?
Gross gaming revenue: total wagers minus the winnings returned to players. It is the standard measure regulators publish, and it is not profit. Operating costs, marketing and the government’s share all come out of it.
-
What are the biggest risks to the forecast?
Three. Oil: an Alberta downturn compresses spending, participation and migration together, and it is the one risk unique to this province. Channelization: if enforcement of the offshore cutoff is weak, fewer players move to regulated sites. Advertising rules: federal or provincial tightening could slow the ramp. All three are priced into the bear case.
-
What does this mean for problem gambling?
Regulation moves offshore players under Alberta’s rules, licensing and self-exclusion system, which is a protection gain in principle. But Alberta’s high gambling propensity also raises exposure to harm, and Canada-wide problem-gambling data is dated. The report treats this as a genuine open question rather than a solved one.
-
What is iGaming.com’s interest in this research?
iGaming.com publishes research and information on regulated gambling markets. The forecast is presented as independent market intelligence, built only on government, regulator and statistical sources, all published on this page so the work can be checked. The findings concern Alberta, its residents and its treasury, not iGaming.com.
-
When will we know if the forecast is right?
The first real test is Alberta’s first published market data, expected in late 2026 or 2027. The single number to watch is channelization, the share of play happening on regulated sites. We have committed to rerunning the model when that data lands and publishing the update on this page.
-
Can I use these numbers and charts?
Yes, with credit: “Alberta Online Gambling Market Forecast, iGaming.com”, linked to this page. Every chart is downloadable above in web and print formats, and the full dataset ships as CSV. For anything not answered here, email press@igaming.com.
AI transparency
This research was produced with AI assistance under human direction. AI tools helped collect and cross-reference figures from government, regulator and statistical publications, run the forecast model’s calculations, and draft the text and charts on this page. The judgement is human: our team scoped the research, set the methodology and assumptions, verified every statistic against its primary source, ran an independent fact-check before publication, and edited and approved the final copy.
iGaming.com takes full responsibility for everything published here, however it was produced. If you spot an error, email press@igaming.com and we will correct it and note the change on this page.